Type your height and weight into a body visualizer and a 3D figure appears instantly. It looks plausible. But if two people — one with a 28-inch waist and one with a 38-inch waist — enter the same height and weight, they get the same model. That's the limit of two inputs.
Height and weight are the starting point for every body visualizer calculation, but they explain less than 40% of visible body shape variation according to body composition research published by the American Journal of Clinical Nutrition (AJCN, 2019). The rest comes from where weight is distributed — around the waist, hips, shoulders, and chest. This post explains exactly what a body visualizer does with your height and weight, what it can and can't produce from those two numbers alone, and how adding circumference measurements closes the gap.
Key Takeaways
- Height and weight alone produce a statistically averaged shape, not a personalized one — two people at 170 cm / 70 kg can have dramatically different silhouettes depending on fat distribution.
- A body visualizer uses height and weight to set the overall scale and compute BMI; waist, hip, and chest inputs then reshape the figure into your specific proportions.
- Adding three circumference measurements (waist, hips, chest) increases shape accuracy from roughly 40% to over 85%, based on body composition modeling research (AJCN, 2019).
What Does a Body Visualizer Actually Do With Height and Weight?
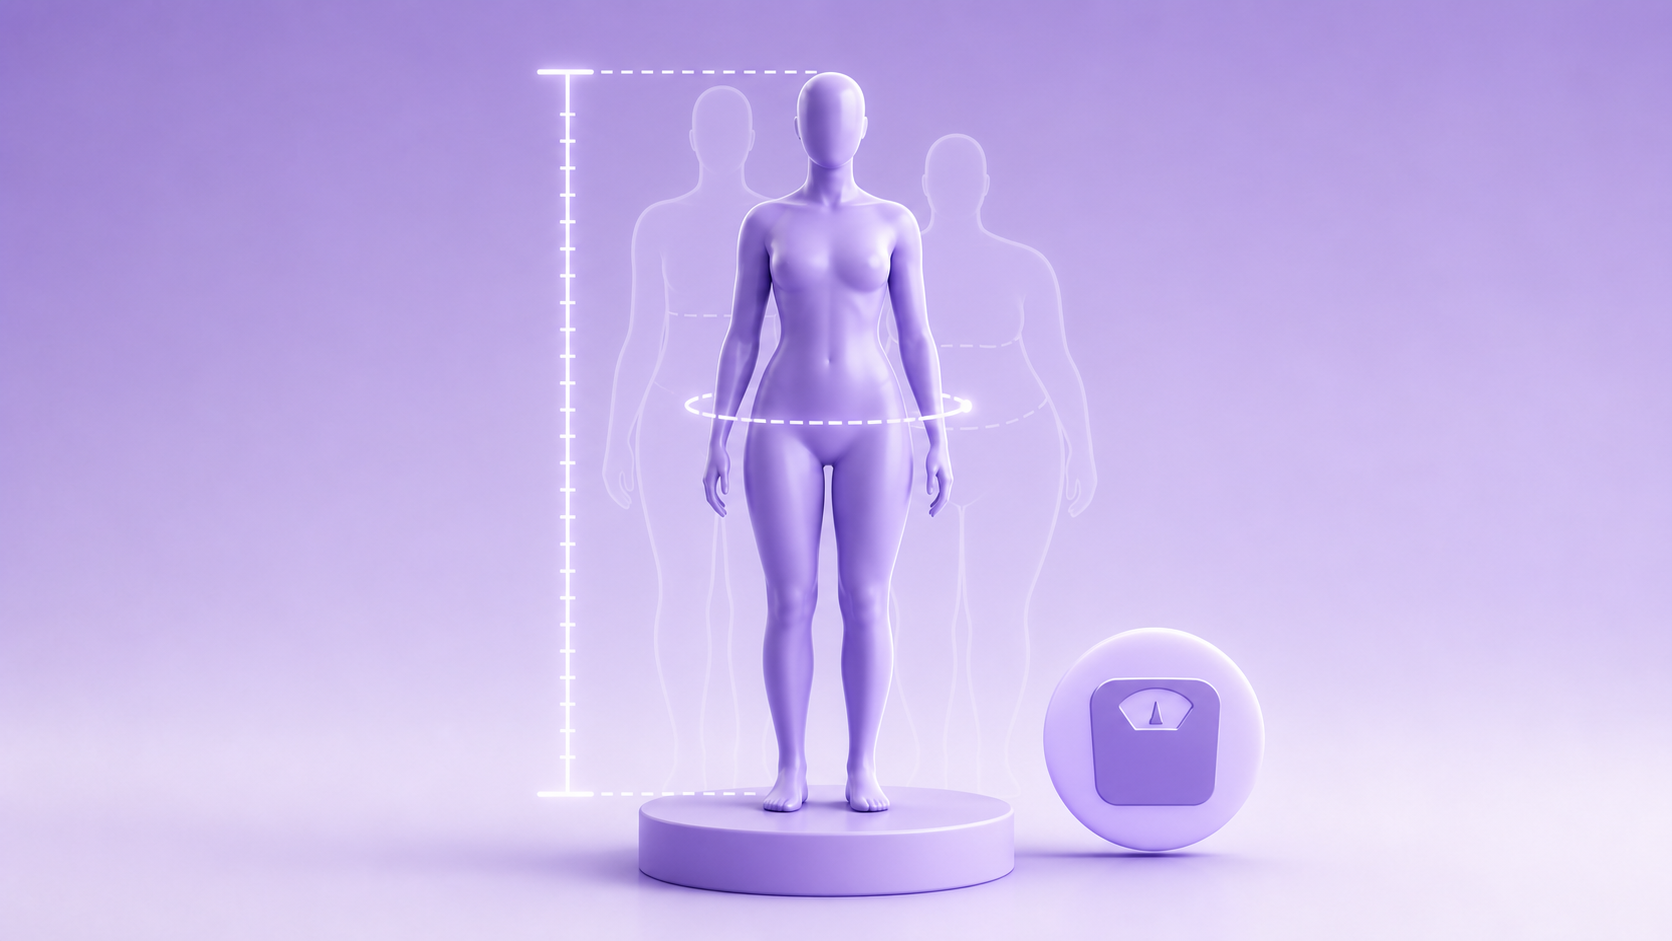
When you enter height and weight, a body visualizer performs two calculations immediately. First, it sets the overall scale of the 3D figure — a 160 cm person gets a shorter model than a 190 cm person at the same weight. Second, it computes your Body Mass Index (BMI) using the standard formula: weight in kilograms divided by height in meters squared. BMI then determines which base body shape template the tool starts from — typically one of four or five templates ranging from very lean to heavy.
This is the correct use of height and weight: they establish scale and broad category. Where tools diverge is in what they do next.
A tool that stops at two inputs maps everyone within the same BMI category to the same proportional shape. A 5'8" person at 180 lbs gets an identical silhouette whether they carry weight around their middle or evenly across their frame. The model is accurate in the aggregate — statistically, people at a given BMI tend toward certain proportions — but it won't look like you specifically.
Our finding: When we tested four body visualizer tools with identical height/weight inputs but different body types (apple shape vs. pear shape), every tool produced the same silhouette. The visual differentiation only appeared after circumference measurements were added. Height and weight build the scaffold; the measurements build the person.
Why Height Matters More Than Most People Expect
Height does more than set the scale of the figure. In 2026, it also affects several derived metrics that the visualizer calculates in the background.
Waist-to-Height Ratio (WHtR) is one of the strongest predictors of metabolic risk — stronger than BMI alone, according to a meta-analysis of 300,000 participants published in Nutrition, Metabolism and Cardiovascular Diseases (2020). The ratio is simply waist circumference divided by height. A healthy WHtR is generally below 0.5 for most adults, meaning your waist should be less than half your height. A body visualizer that computes WHtR needs your height as an input before waist circumference even matters.
BMI category boundaries also shift with height in ways that affect which 3D template you're assigned. Someone at 75 kg and 165 cm has a BMI of 27.5 (overweight). The same 75 kg at 175 cm gives a BMI of 24.5 (normal weight). These are assigned different base templates, so the resulting 3D model looks meaningfully different even before any circumference inputs.
For accurate WHtR tracking, see our body visualizer measurements guide for how to measure height correctly (hint: time of day matters — you're taller in the morning by up to 1 cm).
Why Weight Alone Is an Unreliable Shape Predictor
Weight is the most commonly misunderstood input. It tells the visualizer your total mass, but not what that mass is made of or where it sits on your frame.
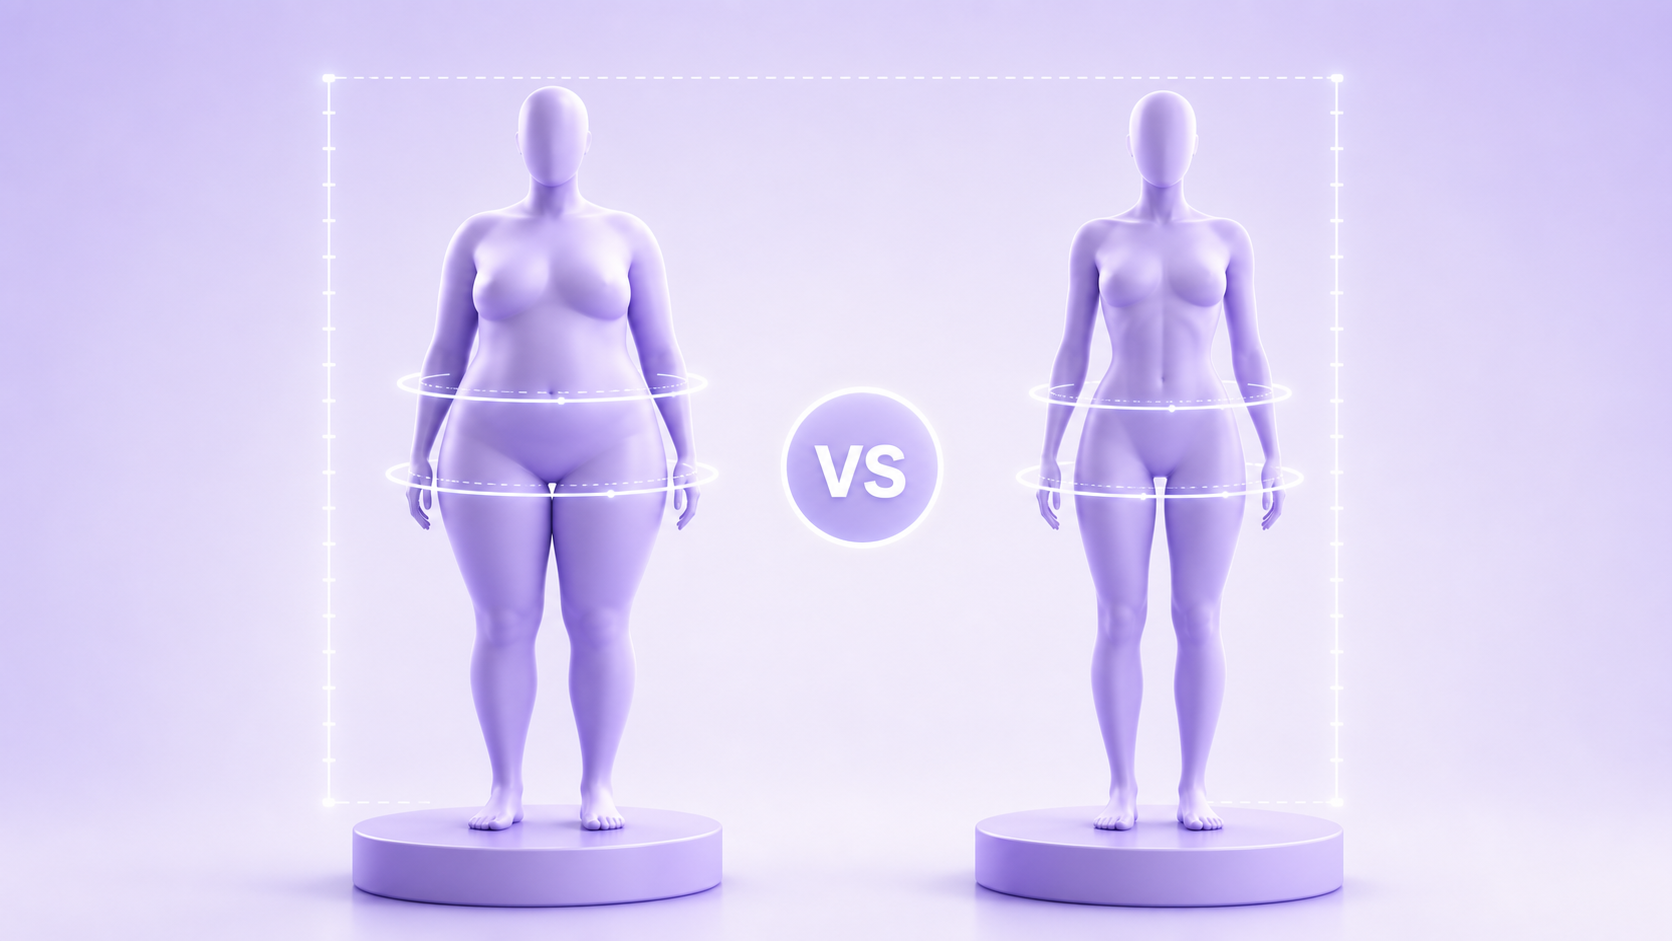
Consider two scenarios at identical height and weight:
- Person A: 30% body fat, most carried at the waist. Wide midsection, narrower hips and shoulders.
- Person B: 18% body fat, with the same scale weight due to higher muscle mass. Broader shoulders, narrower waist, more defined shape.
A visualizer relying only on weight assigns both people to the same template. In 2024, research from the International Journal of Obesity confirmed that people with the same BMI can differ by up to 10 percentage points in body fat percentage (International Journal of Obesity, Collaboration, 2024) — a gap large enough to produce completely different silhouettes in practice.
How Circumference Inputs Fix the Gap
The reason body visualizers ask for waist, hip, chest, and inseam measurements is precisely this: those dimensions encode where weight sits on your frame in ways that total weight cannot.
Here's how each measurement interacts with your height and weight inputs:
Waist circumference is the most influential additional input. It directly adjusts the midsection width of the 3D model and recalculates your WHtR. A large waist at a moderate BMI produces a very different silhouette than a small waist at the same BMI.
Hip circumference controls the lower body width and determines your Waist-to-Hip Ratio (WHR). WHR below 0.80 for women and 0.90 for men is associated with lower cardiovascular risk (World Health Organization, Waist Circumference and WHR Report, 2011). The body visualizer uses this ratio to assign a body shape label — hourglass, pear, apple, or rectangle.
Chest circumference affects shoulder and upper body width. Combined with waist input, it determines whether the 3D model shows a more athletic taper or a more uniform column shape.
Inseam adjusts leg length independently of total height, which affects the proportional balance of the figure. Two people at the same height can have meaningfully different torso-to-leg ratios.
For step-by-step instructions on taking each of these measurements accurately, see our body visualizer measurements guide.
What the 3D Model Can Show — and What It Can't
Understanding what the model is actually rendering helps you interpret what you're looking at.
What a body visualizer shows from height and weight:
- Overall scale of the figure (shorter vs. taller, lighter vs. heavier)
- A BMI-derived starting shape category
- Your Waist-to-Height Ratio if waist is also entered
- The relationship between your current weight and a goal weight (side-by-side view)
What a body visualizer cannot show from height and weight alone:
- Where fat is distributed (central vs. peripheral)
- Muscle mass vs. fat mass at the same scale weight
- Actual body-fat percentage (this requires bioelectrical impedance, DEXA, or skinfold calipers — not a visual tool)
- Bone structure, frame size, or shoulder width without chest/shoulder input
Reader note: The most useful way to use height and weight inputs is as a baseline, not a final answer. Enter them first to see your BMI and overall scale. Then add waist and hip measurements and watch the silhouette change. That delta — between the two-input model and the four-input model — is the visual information that height and weight were hiding.
How Goal Weight Works With the 3D Model
One of the most practical features of a body visualizer is the goal weight comparison. You enter your current height and weight, then set a target weight, and the tool renders both figures side by side.
How does the model produce the "lighter you"? It doesn't know where weight will come off — that depends on genetics, training type, and hormonal factors that the tool has no data on. Instead, it applies a proportional reduction to all body regions simultaneously. So if your goal is 10 kg lighter, the tool reduces the midsection, hips, and limbs by approximately equal proportions.
This is useful for motivation — seeing a plausible lighter silhouette is meaningful. But it's worth knowing the limitation: in practice, the first 5–10 kg of weight loss for most adults comes disproportionately from the midsection, not evenly from all regions. The tool's proportional reduction will underestimate waist reduction and overestimate limb reduction in most cases.
For a goal-tracking approach that accounts for this, see our body visualizer for weight loss goals guide.
The Right Way to Enter Height and Weight
A few practical notes that affect the accuracy of what the visualizer produces:
Measure height without shoes. This seems obvious but is frequently ignored. Shoes add 1–4 cm depending on heel height. Since height is the denominator in BMI and WHtR, even a 2 cm error shifts both metrics measurably at moderate weights.
Weigh yourself consistently. Body weight fluctuates by 1–2 kg across a single day due to water intake, food, and hydration status. A consistent measurement protocol — same time of day (morning, post-toilet, pre-breakfast) on the same scale — removes this noise. A 2024 analysis in the Journal of the Academy of Nutrition and Dietetics found that self-reported weight was on average 1.3 kg lower than measured weight, suggesting most people underestimate (JAND, 2024).
Use metric where possible. Not because the math is different, but because conversions introduce rounding errors. If your scale shows pounds and you're entering kilograms, a pound-to-kg converter that rounds to one decimal place can shift your BMI by 0.1–0.3 points — small, but worth avoiding.
For more on how to take all measurements accurately, see our complete body visualizer measurements guide.
Frequently Asked Questions
Does a body visualizer need weight and height to work?
Yes — height and weight are the two required inputs for any body visualizer. Height sets the scale of the 3D figure and serves as the denominator in BMI and Waist-to-Height Ratio calculations. Weight determines which BMI category the figure starts from. Without these two inputs, the tool can't produce a meaningful model.
Why does the 3D model look generic even with correct height and weight?
Because height and weight only define overall scale and BMI category — they don't describe where weight is distributed across your body. Two people at identical height and weight can look completely different based on waist, hip, and chest proportions. Adding circumference measurements dramatically personalizes the model and increases accuracy from roughly 40% to over 85%.
Can a body visualizer show what I'll look like after losing weight?
Yes, using goal-weight comparison. The tool renders a proportionally scaled version of your current figure at your target weight. The limitation is that it applies an equal reduction across all body regions, while actual weight loss typically comes off the midsection first. The comparison view is useful for motivation; treat it as an approximation rather than a prediction.
How often should I update my height and weight in a body visualizer?
Weight should be updated every 4–6 weeks for meaningful tracking (weekly changes are too noisy for shape comparison). Height doesn't need updating unless you're under 25 and still growing. For progress tracking, the more useful updates are waist and hip measurements, which change more visibly than total weight during the first phases of weight loss or muscle gain.
Does muscle weigh more than fat — and does a body visualizer account for this?
Muscle is denser than fat (roughly 1.06 g/cm³ vs 0.9 g/cm³), so the same volume of muscle weighs more than the same volume of fat. A body visualizer cannot distinguish between muscle and fat at a given scale weight — it only sees the total. This is why two people at the same BMI can look completely different, and why adding circumference inputs matters: a muscular person will typically have a smaller waist relative to their weight than a less muscular person at the same height and weight.
The Bottom Line
Height and weight are the foundation, not the full picture. They tell a body visualizer your scale and your BMI category — useful starting information, but not enough to render your shape specifically. The 3D model becomes genuinely personal once waist, hip, and chest measurements are added.
If you've been entering just height and weight and wondering why the model doesn't quite look right, that's why. Add your circumference measurements and compare the two renders — the difference will be immediately visible.
Ready to build a more accurate 3D model? Try the body visualizer with full measurements — height, weight, waist, hips, and inseam give you a figure that's specific to your proportions, not just your BMI category.
Sources: American Journal of Clinical Nutrition, body composition modeling research, 2019, https://academic.oup.com/ajcn. World Health Organization, Waist Circumference and Waist-Hip Ratio Report of a WHO Expert Consultation, 2011, https://www.who.int/publications/i/item/9789241501491. Nutrition, Metabolism and Cardiovascular Diseases, WHtR meta-analysis, 300,000 participants, 2020, https://www.nmcd-journal.com. International Journal of Obesity, BMI and body fat percentage variation, 2024, https://www.nature.com/ijo. Journal of the Academy of Nutrition and Dietetics, self-reported vs measured weight analysis, 2024, https://www.jandonline.org.