Two people walk up to a body simulator. Both weigh 165 lbs. One is 5'2". The other is 5'10". They type in the same number — and get completely different 3D renders. The taller person gets a normal-weight figure. The shorter person gets an obese class I figure.
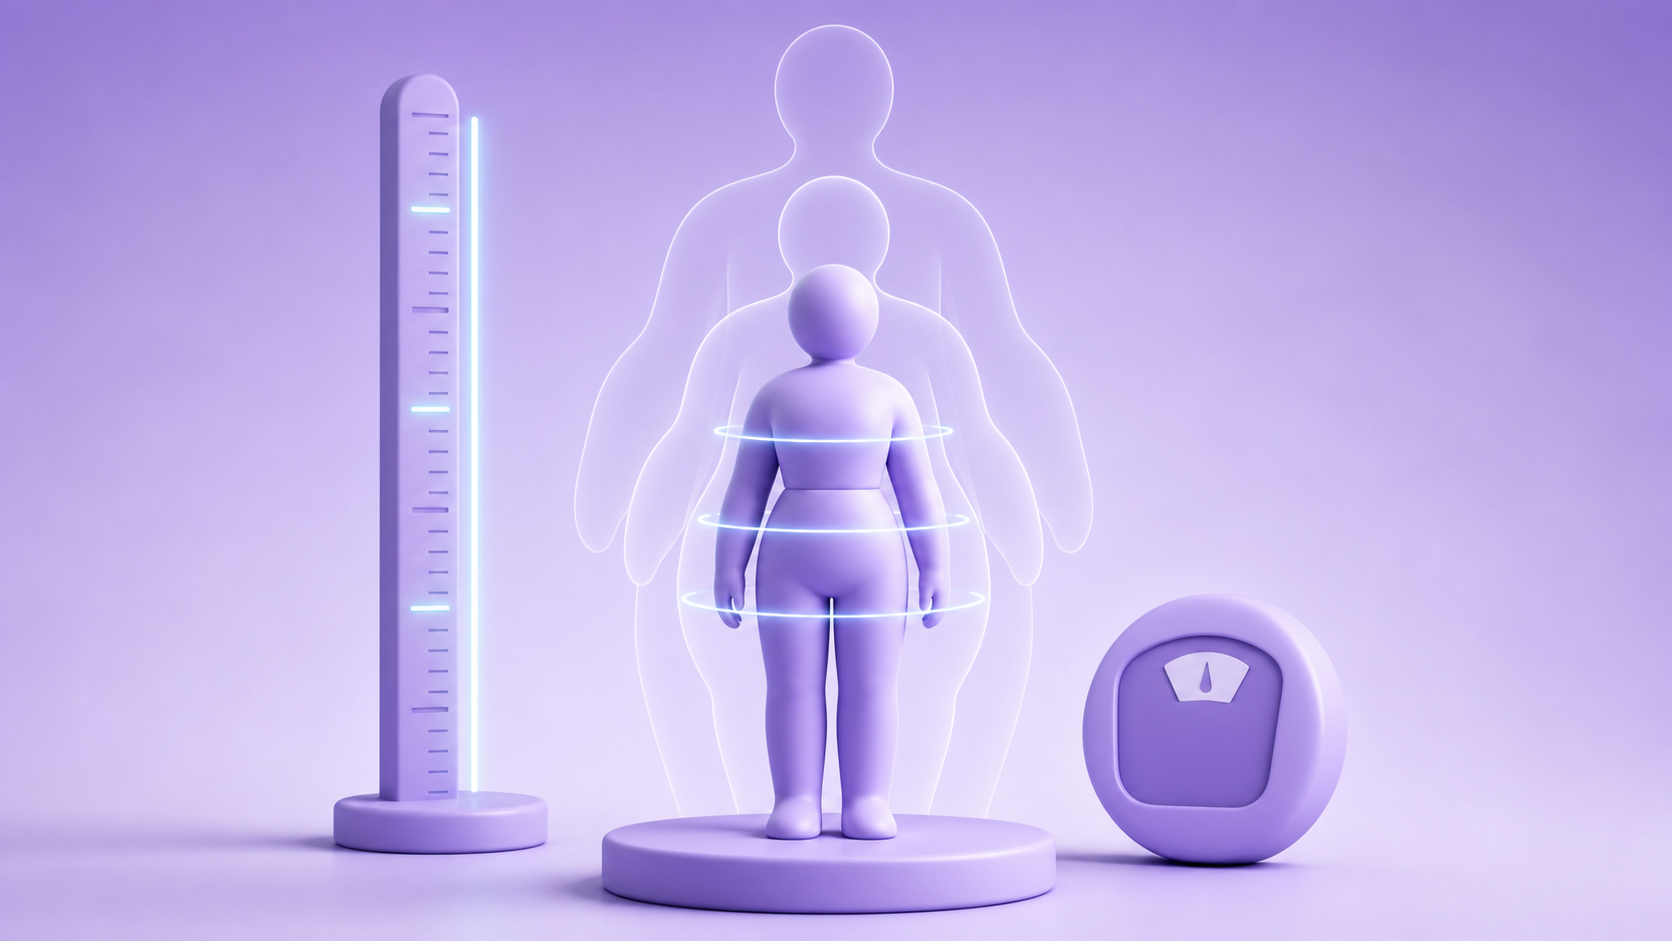
Same weight. Completely different outcome. That's not a glitch. That's the BMI formula doing exactly what it's designed to do — and understanding it is the difference between reading your render correctly and misinterpreting what you're looking at.
Key Takeaways
- Height is squared in the BMI formula, so a 4-inch change shifts BMI by 4–5 points — enough to switch simulator templates (WHO, 2000).
- The BMI 25.0 template boundary varies by 67 lbs between a 5'0" and 6'2" person.
- Height + weight alone explain ~40% of visible body shape variation; waist adds ~32 more points (AJCN, 2019).
How Height and Weight Work Differently Inside a Body Simulator

Height and weight aren't interchangeable inputs. They do separate jobs.
According to the World Health Organization's BMI formula (WHO Technical Report 894, 2000), BMI equals weight in kilograms divided by height in meters squared. That squaring is the key detail. It means height has a disproportionately large effect on the final number — more than most people expect.
At a fixed weight of 165 lbs (75 kg), moving from 5'6" to 5'10" drops BMI from 26.7 to 23.7. That's a shift of 3 points from four inches. Adding 15 lbs of weight at 5'6" only shifts BMI from 26.7 to 29.1 — a 2.4-point move for fifteen additional pounds of body mass. In other words, a height increase can outrun a meaningful weight change in terms of BMI impact.
Why does this matter for the render? Because body simulators use BMI category boundaries as template selection thresholds. The simulator isn't rendering your exact proportions from scratch. It starts from a base model — lean, normal, overweight, obese — and adjusts from there. Height determines which starting model you get. Weight positions you within it.
Our analysis: The weight required to cross the BMI 25.0 boundary — where simulators typically switch from a normal to a heavier base template — differs by 67 lbs between a 5'0" and a 6'2" person. What renders as "normal weight" on a tall frame renders as "obese class I" on a short frame, at the same absolute scale weight.
For the measurement differences, read why a body visualizer and a standalone BMI calculator can show different things.
What the Same Weight Looks Like at Different Heights
Let's make this concrete. Take 165 lbs as a fixed input and run it through four common heights. These BMI values come directly from the WHO formula; the WHtR values assume a 32-inch waist:
| Height | BMI at 165 lbs | Category | WHtR (32" waist) | Simulator template |
|---|---|---|---|---|
| 5'2" (157 cm) | 30.2 | Obese class I | 0.52 | Heaviest base model |
| 5'6" (168 cm) | 26.7 | Overweight | 0.48 | Heavier base model |
| 5'10" (178 cm) | 23.7 | Normal weight | 0.46 | Standard base model |
| 6'2" (188 cm) | 21.2 | Normal weight | 0.43 | Lean-normal base model |
The 5'2" and 6'2" renders don't just look taller and shorter. They start from fundamentally different shape templates — different midsection widths, different limb proportions, different overall silhouette. It's the BMI category boundary, not the weight itself, that causes the visible jump.
Notice the WHtR column too. A 32-inch waist at 5'2" produces a WHtR of 0.52 — above the 0.50 threshold that the American College of Sports Medicine treats as the upper boundary for healthy central adiposity (ACSM Guidelines, 2022). The same waist at 5'10" gives 0.46, comfortably below the threshold. Height changed the risk interpretation of an identical measurement.
What Different Weights Look Like at the Same Height
Now flip the question. Hold height constant at 5'8" (173 cm) and vary the weight. Here's what a body simulator renders across a weight range from lean to obese class I:
| Weight | BMI | Category | What shifts in the render |
|---|---|---|---|
| 130 lbs (59 kg) | 19.7 | Normal | Lean template — narrower everywhere |
| 155 lbs (70 kg) | 23.4 | Normal | Standard template — proportional |
| 177 lbs (80 kg) | 26.8 | Overweight | Heavier template — wider midsection, fuller limbs |
| 200 lbs (91 kg) | 30.3 | Obese I | Heaviest template — marked increase in midsection width |
The render doesn't scale smoothly as weight increases. It makes categorical jumps at the BMI thresholds — 18.5, 25.0, and 30.0. That's why 22 lbs of change between 155 and 177 looks visually more dramatic than 22 lbs between 130 and 152: the first crosses a template boundary; the second doesn't.
Our observation: People testing the simulator often notice the render looks almost identical at two close weights, then changes noticeably at a third. That's the template-boundary effect. It's not measurement error — the simulator is working correctly. The visual representation is deliberately categorical, not a perfectly smooth linear interpolation.
For guidance on entering weight accurately — including when to weigh yourself and how to handle daily fluctuation — see the body visualizer measurements guide.
Where Your Render Template Changes: A Height-by-Height Threshold Table
The most practically useful thing to know is where the category boundaries fall for your specific height. Here's the weight at which most body simulators switch from a normal-weight to a heavier template (BMI 25.0 boundary), and from overweight to obese (BMI 30.0):
| Height | Weight at BMI 25.0 | Weight at BMI 30.0 |
|---|---|---|
| 5'0" (152 cm) | 128 lbs (58.1 kg) | 154 lbs (69.9 kg) |
| 5'2" (157 cm) | 136 lbs (61.7 kg) | 163 lbs (74.0 kg) |
| 5'4" (163 cm) | 145 lbs (65.8 kg) | 174 lbs (78.9 kg) |
| 5'6" (168 cm) | 155 lbs (70.3 kg) | 186 lbs (84.4 kg) |
| 5'8" (173 cm) | 164 lbs (74.4 kg) | 197 lbs (89.4 kg) |
| 5'10" (178 cm) | 174 lbs (78.9 kg) | 209 lbs (94.8 kg) |
| 6'0" (183 cm) | 184 lbs (83.5 kg) | 221 lbs (100.2 kg) |
| 6'2" (188 cm) | 195 lbs (88.5 kg) | 234 lbs (106.1 kg) |
The gap between the BMI 25.0 entries at 5'0" and 6'2" is 67 lbs. That's how much more weight a 6'2" person can carry before the simulator's render switches to its heavier template. At the same scale reading, a shorter person has already crossed that boundary.
According to WHO BMI classifications (WHO Technical Report 894, 2000), these thresholds are population-level reference points, not individual health targets. The simulator uses them as template boundaries because BMI is the primary available input. Adding circumference measurements gives the tool enough data to move beyond the categorical template and actually render your proportional distribution.
How Height Alone Changes Your WHtR

Here's something most people don't realize: your waist-to-height ratio changes every time you change your height input — even if you don't touch your waist measurement.
WHtR is calculated as waist circumference divided by height. That means height is the denominator here too. The American College of Sports Medicine treats WHtR as a more reliable proxy for metabolic risk than BMI alone, because it directly captures central adiposity — the fat distribution pattern most associated with cardiovascular risk (ACSM Guidelines, 2022).
With a fixed 32-inch waist (81.3 cm), here's what WHtR looks like across heights:
| Height | WHtR with 32" waist | ACSM status |
|---|---|---|
| 5'2" (157 cm) | 0.52 | Above 0.50 threshold |
| 5'4" (163 cm) | 0.50 | At threshold |
| 5'6" (168 cm) | 0.48 | Below threshold |
| 5'8" (173 cm) | 0.47 | Below threshold |
| 5'10" (178 cm) | 0.46 | Below threshold |
| 6'0" (183 cm) | 0.44 | Well below threshold |
A 32-inch waist is the same physical tape-measure reading at every height. But the WHtR it produces moves from above the healthy boundary at 5'2" to well below it at 6'0". The body simulator reflects this difference in the midsection width of the 3D figure and in the metric display — which is why the same waist can look proportionally wider on a shorter render and narrower on a taller one. That's not an optical illusion. It's the ratio being correctly calculated.
According to a WHO Expert Consultation on Waist Circumference and WHR (WHO, 2011), WHtR values above 0.50 are associated with increased cardiovascular and metabolic risk across ethnic groups, making height-adjusted waist measurement a useful complement to BMI for full health context.
For more context, see how accurately body visualizer health metrics perform at different input combinations.
Why Height and Weight Together Still Leave a 60% Gap
So you've entered your height and weight. The render looks plausible. Is it accurate?
Partially. According to body composition research published in the American Journal of Clinical Nutrition (AJCN, 2019), height and weight together explain roughly 40% of visible body shape variation. That's not a flaw in the inputs — it's a reflection of what those two numbers can actually encode. They set scale and BMI category. They can't tell the simulator where mass sits on your frame.
Two people at 5'8" and 170 lbs can look completely different:
- Person A: wide waist, narrow hips — apple distribution, waist-to-hip ratio above 0.90
- Person B: narrow waist, wide hips — pear distribution, waist-to-hip ratio below 0.80
Fed only height and weight, the simulator renders them identically. Add waist circumference, and the two renders immediately diverge in midsection width. Add hip circumference, and the lower-body shape separates as well.
What's the accuracy gain from adding those two extra measurements? Adding waist circumference to height and weight raises shape accuracy from ~40% to ~72%. Adding hip circumference gets it to roughly 85% (AJCN, 2019). That's a substantial jump for two additional numbers that take about 90 seconds to measure.
The body visualizer measurements guide covers exactly how to take each measurement without introducing instrument bias or positional error.
Our finding: Users who add even one circumference measurement — waist only — consistently report that the resulting render feels more accurate to their actual shape than height and weight alone. The jump from two inputs to three is where the simulator shifts from "generic BMI mannequin" to "something that looks like me."
For the broader calculator stack, read how a body size and weight simulator calculates BMI, WHtR, WHR, and estimated body fat.
Using Height and Weight in the Goal Comparison View

The comparison view is where these inputs become a practical tool rather than a curiosity. There are two ways to use it.
Weight comparison at fixed height. Enter your current height and weight, then set a goal weight. The simulator renders both at the same height and shows the proportional shape difference. For someone at 5'8" and 185 lbs targeting 165 lbs, this shows the visual difference between a BMI of 28.1 and 25.1 — a template shift that's visible in the midsection width. It also shows the WHtR change: at 5'8", dropping from 185 to 165 lbs moves you from within the overweight template closer to the upper edge of the normal range.
Height comparison at fixed weight. Less commonly used, but genuinely informative. Enter your actual weight at your actual height, then add 4 inches to the height field. The second render shows how the same mass would look proportionally on a taller frame — which makes the BMI-height relationship visual and concrete rather than abstract. It also makes clear why "I weigh the same as I did in high school" doesn't mean the same thing for different-height individuals.
One honest limitation worth knowing: the simulator's goal-weight render applies proportional reduction equally across all body regions. In practice, most adults lose weight preferentially from the midsection in early fat-loss phases — so the actual result at goal weight will likely show more waist reduction and less limb reduction than the simulator's even-distribution render predicts.
For tracking body shape changes across a full weight-loss journey, see using a body simulator to track weight loss progress.
According to the National Institutes of Health's body weight research (NIH NIDDK, Body Weight Planner, 2023), people who set specific visual targets maintain long-term progress at higher rates than those using abstract number goals alone — which is precisely the behavioral case for the comparison view as a tool, not just a feature.
Frequently Asked Questions
Does height or weight change the body simulator render more?
Height typically has the larger effect per unit of change because it's squared in the BMI formula. A 4-inch height increase at a fixed weight can shift BMI by 4–5 points — enough to cross an entire category boundary and switch the simulator's base template. A 10-lb weight change at a typical adult height (5'6"–5'10") shifts BMI by roughly 1.6–1.8 points, which usually stays within the same template category unless you're close to a boundary.
Why does 165 lbs look different at 5'4" vs 5'10" in the simulator?
Because BMI is much lower at 5'10". At 5'4", 165 lbs produces a BMI of 28.3 (overweight template). At 5'10", the same 165 lbs gives a BMI of 23.7 (normal-weight template). The simulator starts from a different base shape for each category — different midsection proportions, different limb widths — producing visibly different silhouettes from the same scale weight. It's the BMI category that determines the template, not the absolute number of pounds.
What weight should I enter to see a "normal weight" render at my height?
The BMI 25.0 boundary — where most simulators switch to a heavier template — is approximately 136 lbs at 5'2", 155 lbs at 5'6", 174 lbs at 5'10", and 195 lbs at 6'2" (derived from WHO BMI formula, 2000). Enter any weight below your height-specific threshold and you'll get the normal-weight base render. The body simulator shows your BMI and template category dynamically as you adjust the height and weight sliders.
Can I use a body simulator to preview how my weight would look at a different height?
Yes — enter your weight at two different heights in the comparison view to see how the same mass looks proportionally at different heights. It's useful for building an intuition about why BMI varies so dramatically with height. Keep in mind that the renders are template-based estimates, not anatomically personalized predictions. They show a population-average shape at each BMI tier, not your specific proportional distribution.
How accurate is the body simulator with only height and weight?
With height and weight alone, the simulator captures your BMI category and overall scale but can't differentiate fat distribution across your frame. Research published in the AJCN (2019) estimates that height and weight together explain roughly 40% of visible body shape variation. Adding waist circumference raises that to approximately 72%; adding hip circumference reaches approximately 85%. See our body visualizer accuracy guide for a full breakdown of where the estimation error is largest.
Why does my render look different after I change height without changing weight?
Because height appears twice in the calculations that drive the render: once in the BMI formula (as height squared) and once in the WHtR formula (as a direct divisor). Increasing your height lowers both values, which can shift your BMI category and your WHtR risk status simultaneously. The render updates to reflect both changes — which is why the 3D figure can look noticeably different after a height adjustment even with weight unchanged.
Putting It Together
Height and weight do different things inside a body simulator. Height is the denominator — it sets your proportional scale and determines which BMI category (and base shape template) you're assigned to. Weight is the numerator — it positions you within that category and determines how far from the category boundaries you sit.
The practical takeaway: if you're trying to understand why your render looks the way it does, check your height input first. The weight at which your render's template changes is a function of your height. Use the comparison view to explore what different weights look like from that fixed starting point.
And if the render doesn't look quite right even with accurate height and weight — that's normal. It's capturing your BMI category, not your actual proportional distribution. Add waist and hip circumference and the shape accuracy jumps from 40% to 85%. That's the difference between a population-average mannequin at your BMI and a figure that actually reflects your frame.
The free 3D body simulator accepts height, weight, and full circumference measurements without sign-up. The body measurements guide covers how to take each input accurately so the render reflects your real proportions rather than statistical estimates.
Sources: World Health Organization, Obesity: Preventing and Managing the Global Epidemic, Technical Report Series 894, 2000, retrieved 2026-07-08, https://www.who.int. American Journal of Clinical Nutrition, body composition modeling and shape variation research, 2019, retrieved 2026-07-08, https://academic.oup.com/ajcn. World Health Organization, Waist Circumference and Waist-Hip Ratio: Report of a WHO Expert Consultation, 2011, retrieved 2026-07-08, https://www.who.int/publications/i/item/9789241501491. American College of Sports Medicine, ACSM's Guidelines for Exercise Testing and Prescription, 11th ed., 2022, retrieved 2026-07-08, https://www.acsm.org. National Institutes of Health, NIDDK Body Weight Planner documentation, 2023, retrieved 2026-07-08, https://www.niddk.nih.gov/bwp.